
ArkMalibu Industry Snapshots, First Quarter 2024 (Released 1/31/2024)
We invite you to read our M&A market analysis, below. Please feel free to contact us at (513) 583-5413 to discuss how the information presented in this report may relate to your business and its own unique set of value drivers.
U.S. & Canada M&A Overview – Deal volume returns to pre-pandemic levels after two years of elevated activity
- 2023 saw M&A deal count finally corrected from the pandemic-induced bubble, returning to pre-pandemic levels after record-setting highs in deal volume in 2021 and 2022; private equity deal volume was depressed in 2023 due to economic uncertainty and high financing costs
- 2023 saw 15,278 deals, representing an 18% drop YoY, but remaining in line with the 2015-2019 average
- The year’s median Enterprise Value/EBITDA multiple of 11.1x came in 11% above last year’s figure
- Notably, the total reported transaction value in 2023 of $1.8tn was up 14% YoY
- The year’s combination of reduced deal volume with a higher median EBITDA multiple and elevated total transaction value suggests that investors are willing to pay a premium for size and safety while riskier deals are avoided, which corresponds with anecdotal evidence from investors
- The decline in deal activity is headlined by reduced activity from private equity investors, with high interest rates crippling the leveraged buyout (LBO) market in recent months
- LBO activity hit a five-year low in 2023, while dropping leverage ratios show that the deals that did get done were more conservatively financed
- With interest rates projected to decline throughout 2024, M&A is expected to pick up substantially; as PE/VC holding periods extend and a backlog of investors looking to exit their positions builds up, loosening lending criteria and cheaper debt is expected to allow greater deal flow to resume
Global M&A Overview
- Globally, 2023 saw deal count fall 13% YoY; capital invested through M&A remained flat at $2.7tn while the median EV/EBITDA multiple rose to 10.2x, up 7% YoY
- This falloff in M&A activity is closely aligned with that of the U.S. and Canada, reflecting the global nature of the headwinds facing the dealmaking market
U.S. & Canada M&A Overview of Selected Players
- Strategics
- 2023 saw 7,686 acquisitions made by strategic acquirers in the U.S. & Canada, marking a 13% decrease YoY
- The YoY decline was led by the Agriculture (-38%), Utilities (-36%), and Non-Financial Services (-32%) sectors
- These declines were mitigated in part by higher deal counts in Semiconductors (65%), Energy Services (56%), and Energy Exploration (32%)
- 2023 saw 7,686 acquisitions made by strategic acquirers in the U.S. & Canada, marking a 13% decrease YoY
- Private Equity
- The number of exits by PE firms dropped significantly from 2022 to 2023, with the 26% decline corresponding with lengthening median holding periods for PE investors
- The median PE hold period has increased from 4.8 years in 2021 to 6.4 years in 2023
- Following a number of successful PE exit IPOs towards the end of 2023, investors expect IPO activity to strengthen in 2024
- PE acquisition deal count remained slightly above pre-pandemic levels in 2023, though total deal value sank to its lowest point since 2017
- The amount spent on platform acquisitions declined substantially in 2023, falling nearly 37% YoY and 52% from its peak in 2021
- This is largely due to tightening lending criteria and higher interest rates, which have driven debt as a percentage of enterprise value to an average of 46% in 2023, down from 51% a year prior
- Valuations paid by PE firms also declined in 2023, with the median EV/EBITDA multiple falling nearly a full turn from 11.9x in 2022 to 10.8x in 2023
- This is partially a function of the tilt toward smaller add-on deals with lower multiples as platform deal count declines
- Add-on deal volume has been steadily growing in recent years, with 76% of all PE deals in 2023 classified as add-ons
- The amount spent on platform acquisitions declined substantially in 2023, falling nearly 37% YoY and 52% from its peak in 2021
- The number of exits by PE firms dropped significantly from 2022 to 2023, with the 26% decline corresponding with lengthening median holding periods for PE investors
- Venture Capital
- 2023 marked the popping of the venture capital bubble after the torrent of activity in 2021 and 2022, with deal value and volume falling back to roughly the same levels seen in 2020
- Total early-stage investment deal volume fell by 18% YoY while total deal value fell 30% YoY
- Despite a strong third quarter, venture capital exit activity hit a decade low in 2023, with the year’s $61.5bn of deal value coming in below the $65.5bn in 2016, the lowest year since 2013
- 2023’s exit volume of 1,129 remained slightly above the decade low of 943 seen in 2013
- 2023 marked the popping of the venture capital bubble after the torrent of activity in 2021 and 2022, with deal value and volume falling back to roughly the same levels seen in 2020
U.S. Equity Market Overview
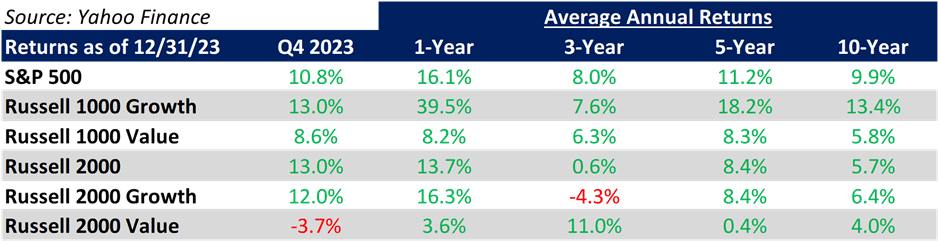
- Major publicly traded stock indexes saw a resurgence in Q4 2023, including the S&P 500, which rose 10.8% in Q4 for a 1-year return of 16.1%
- This increase is partially due to a significant influx of capital into tech companies offering AI and AI-adjacent products and services; growth outpaced value for the quarter as both the Russell 1000 and Russell 2000 growth indices beat the equivalent value indices
- Full-year 2023 performance for S&P 500 stocks inverted the annual results from 2022, with the laggards of 2022 becoming the leaders of 2023
- The stocks composing the top-performing quintile in 2022 fell to the worst-performing quintile in 2023, with annual return declining sharply from 26% to 2%; this trend persisted among all other quintiles
- Contributing to this trend was the reversal of fortunes for the tech and energy sectors; S&P 500 energy stocks returned 5% in 2023 after returning 59% in 2022 while tech returned 56% in 2023
- Q4 2023 earnings for S&P 500 companies are expected to come in 4.4% higher YoY per consensus estimates, with analysts predicting that the earnings recovery will continue to accelerate throughout 2024
- The S&P 500 forward 12-month P/E ratio is 19.5x, which represents an 11% premium to the 10-year average of 17.6x
- The IPO market is expected to make a comeback in 2024 after two down years, with the success of a few high-profile IPOs at the end of 2023 and expectations of a pivot by the Fed driving optimistic sentiment
- Late 2023 marked a partial recovery for the IPO market, with volume increasing by 42% and proceeds growing by 160% from 2022
- This significant increase in performance was driven by oversubscription and strong initial pricing outcomes for a handful of closely-watched companies like Birkenstock, Klayvio, and Instacart; these stocks have largely disappointed since their listing though, with each posting a decline from its elevated IPO price in the weeks following
Economic Update
- In the December 2023 report, U.S. CPI was 0.3% higher MoM for a 3.4% increase YoY, slightly below consensus expectations; core CPI (excluding food and energy) came in higher by 0.3% MoM, representing a 3.9% rise YoY
- Prices for services are up 4% on a YoY basis, while energy is down 2% YoY, led by a 15% YoY drop in fuel oil prices
- Wages rose slightly in December, with the average hourly nonfarm earnings rising by 15 cents to $34.27; this figure marks a 4% increase from December 2022
- Minutes from the Federal Reserve’s December meeting indicate that interest rate cuts should be expected in 2024 and will likely be in the neighborhood of 75 basis points in total; the median “dot plot” Fed forecast shows a rate of 4.6% by year end 2024
- Members expect that the Fed will cut overnight borrowing rates back to their long-run average of 2.0-2.5% over the next three years, down from their current benchmark rate range of 5.25% to 5.5%
- High interest rates continue to weigh down the housing market, with existing home sales for the year dropping to their lowest level since 1995; 30-year mortgage rates in December held at 6.6%, up 45 basis points from last year
- Bonds have largely held steady over the course of the year, with the S&P Aggregate Bond Index up 1.1% in 2023
- The Federal Reserve expects real GDP growth to come in at 2.6% for full-year 2023, above their previously released expectation of 2.1% from September
- The U.S. ISM PMI manufacturing index indicated a slight contraction in the manufacturing industry in December; the FRB’s Industrial Production Index (which measures current real output) showed a corresponding 3% decline in 2023
- The December jobs report showed 216,000 nonfarm jobs added, led by growth in Private Education and Healthcare; the unemployment rate remained flat MoM at 3.7%, slightly below last December’s mark of 3.9%
- Measures reflecting the total number of people in the workforce such as the employment population ratio and the labor force participation rate have remained steady in recent months, holding at 60.1% and 62.5%, respectively
- Global economic growth outperformed expectations in 2023, posting a growth rate of 2.7%, 0.5% above the last UN forecast issued in May
- Due to persistent high interest rates and rapidly increasing geopolitical instability, the UN forecasts a decline in growth in 2024, predicting a 2.4% growth rate for the year
- As domestic recession fears continue to wane, 76% of economists surveyed believe that there is a less than 50% chance of recession in 2024
- Of the economists that believe a recession is imminent, 40% believe it will come in the first quarter, while 36% believe it will come in the second quarter
Sources: ArkMalibu, Bureau of Labor Statistics, Federal Reserve, CNBC, EY, S&P Capital IQ, The Wall Street Journal, The International Monetary Fund, ISM, National Association of Realtors, Bankrate, Reuters, Yahoo Finance, Forbes, Pitchbook and other publicly available news sources